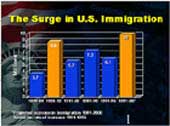
The following data on
immigration by decade and by geographic region is taken from the
Statistical
Yearbook of the Immigration and Naturalization Service
for 1994 and updated for 1995 data:
Period     Total        Europe        Asia      Americas   Africa   Oceania *


1821-30     143,439      98,797          30      11,564        16    33,032

1831-40     599,125     495,681          53      33,424        54    69,911

1841-50   1,713,251   1,597,442         141      62,469        55    53,144

1851-60   2,598,214   2,452,577      41,538      74,720       210    29,169

1861-70   2,314,824   2,065,141      64,759     166,607       312    18,005

1871-80   2,812,191   2,271,925     124,160     404,044       358    11,704

1881-90   5,246,613   4,735,484      69,942     426,967       857    13,363

1891-00   3,687,564   3,555,352      74,862      38,972       350    18,028

1901-10   8,795,386   8,056,040     323,543     361,888     7,368    46,547

1911-20   5,735,811   4,321,887     247,236   1,143,671     8,443    14,574

1921-30   4,107,209   2,463,194     112,059   1,516,716     6,286     8,954

1931-40     528,431     347,566      16,595     160,037     1,750     2,483

1941-50   1,035,039     621,147      37,028     354,804     7,367    14,693

1951-60   2,515,479   1,325,727     153,249     996,944    14,092    25,467

1961-70   3,321,677   1,123,492     427,642   1,716,374    28,954    25,215

1971-80   4,493,314     800,368   1,588,178   1,982,735    80,779    41,254

1981-90   7,338,062     761,550   2,738,157   3,615,225   176,893    46,237

1991-95   5,230,313     760,106   1,582,764   2,706,615   151,101    29,727

175 yrs.  62,215,942  37,853,476  7,601,938  15,773,776   485,245   501,507*


* includes others unidentified by nationality, as often happened before 1911.
|


